One Piece TCG: The Real-World Boom vs. Traditional Markets
The One Piece Trading Card Game is more than just a hobby for fans of the Straw Hat crew. It has evolved into a serious collector’s market where high-grade cards regularly fetch thousands of dollars. To understand this growth, we looked at real USD price data and compared it to the gold standard of traditional finance: the S&P 500. Collectors are now using tools like TheTCGIndex.com to track these trends and build custom indexes for their favorite cards.
A Snapshot of One Piece TCG Values
While there isn't a single "official" market index for One Piece cards yet, marketplace data and auction results show a clear upward trend for key assets. Here are a few recent price points for PSA 10 (professionally graded) cards:
- Monkey D. Luffy Alt-Art (ST05-119): PSA 10 copies generally list between $400 and $650, though rare "Nika" variants have seen eBay listings cross the $7,200 mark.
- Tony Tony Chopper (Manga Art): Graded manga art examples have listed for roughly $1,780, proving that specific character art can command a massive premium.
- Nami Variations: Alternate art and premium variants typically trade between $300 and $1,200 depending on the specific print.
- Shanks (Manga Alternate Art): High-grade auctions for this card have hit $2,700, with average sales staying well above $1,100.
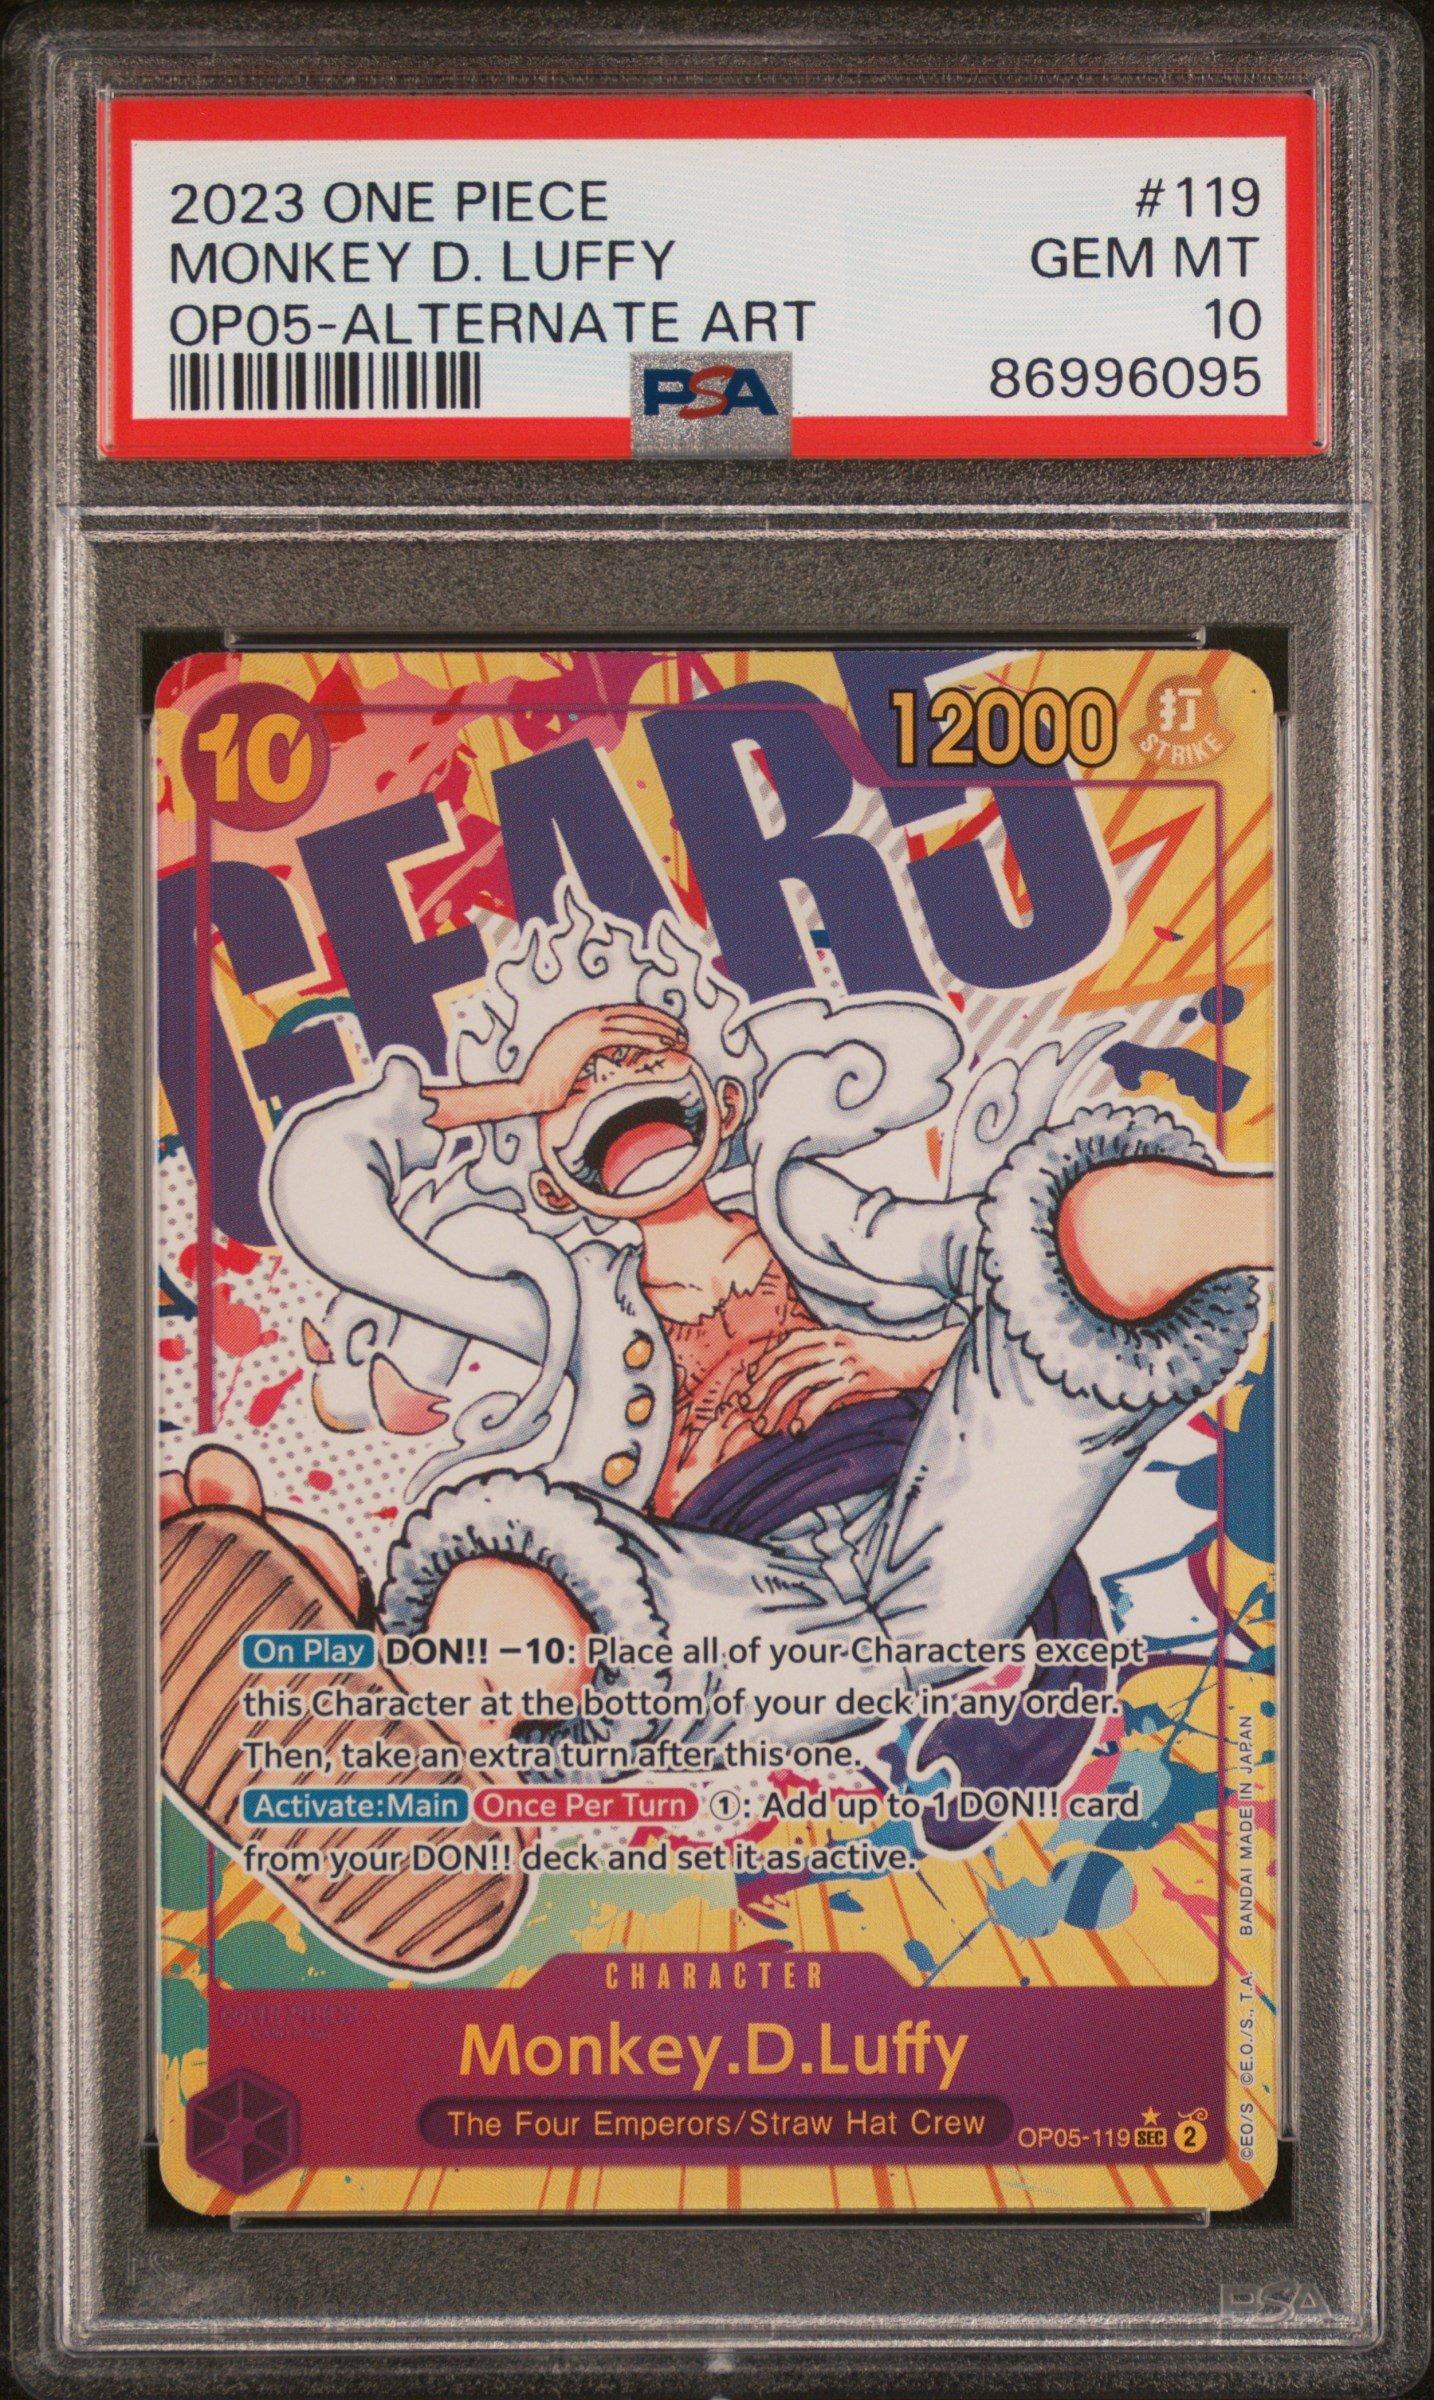
Monkey D. Luffy (ST05-119) — PSA 10 examples
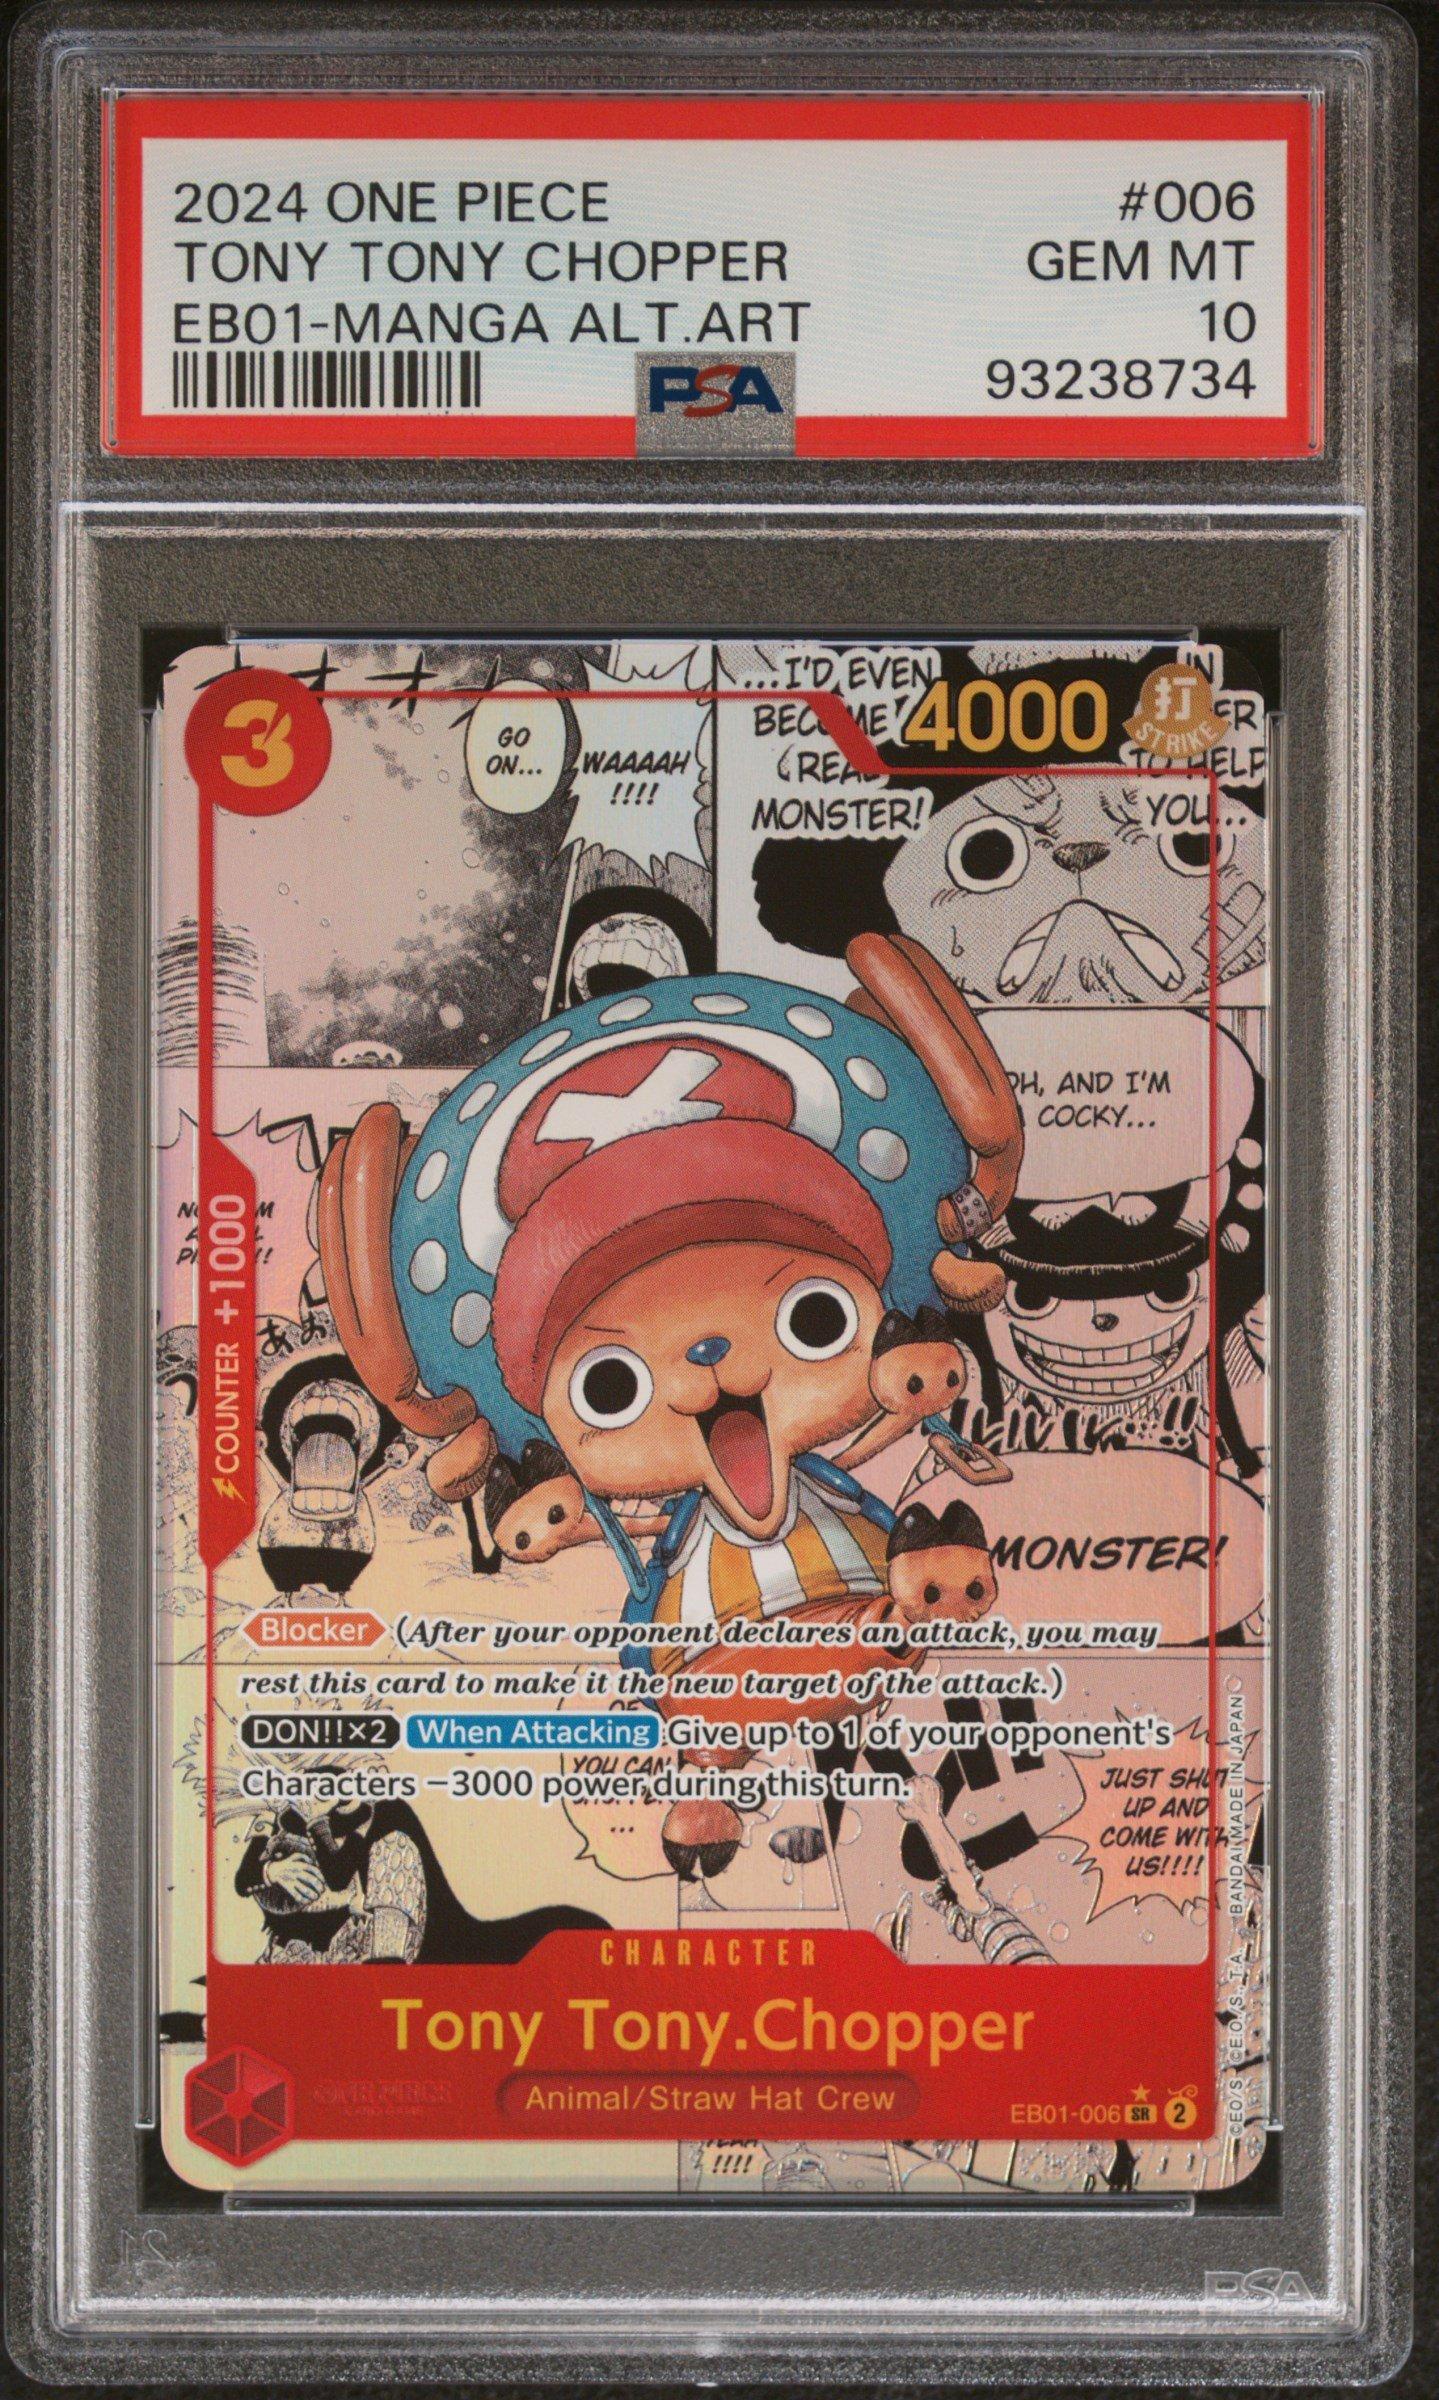
Tony Tony Chopper — Manga Art (PSA 10)
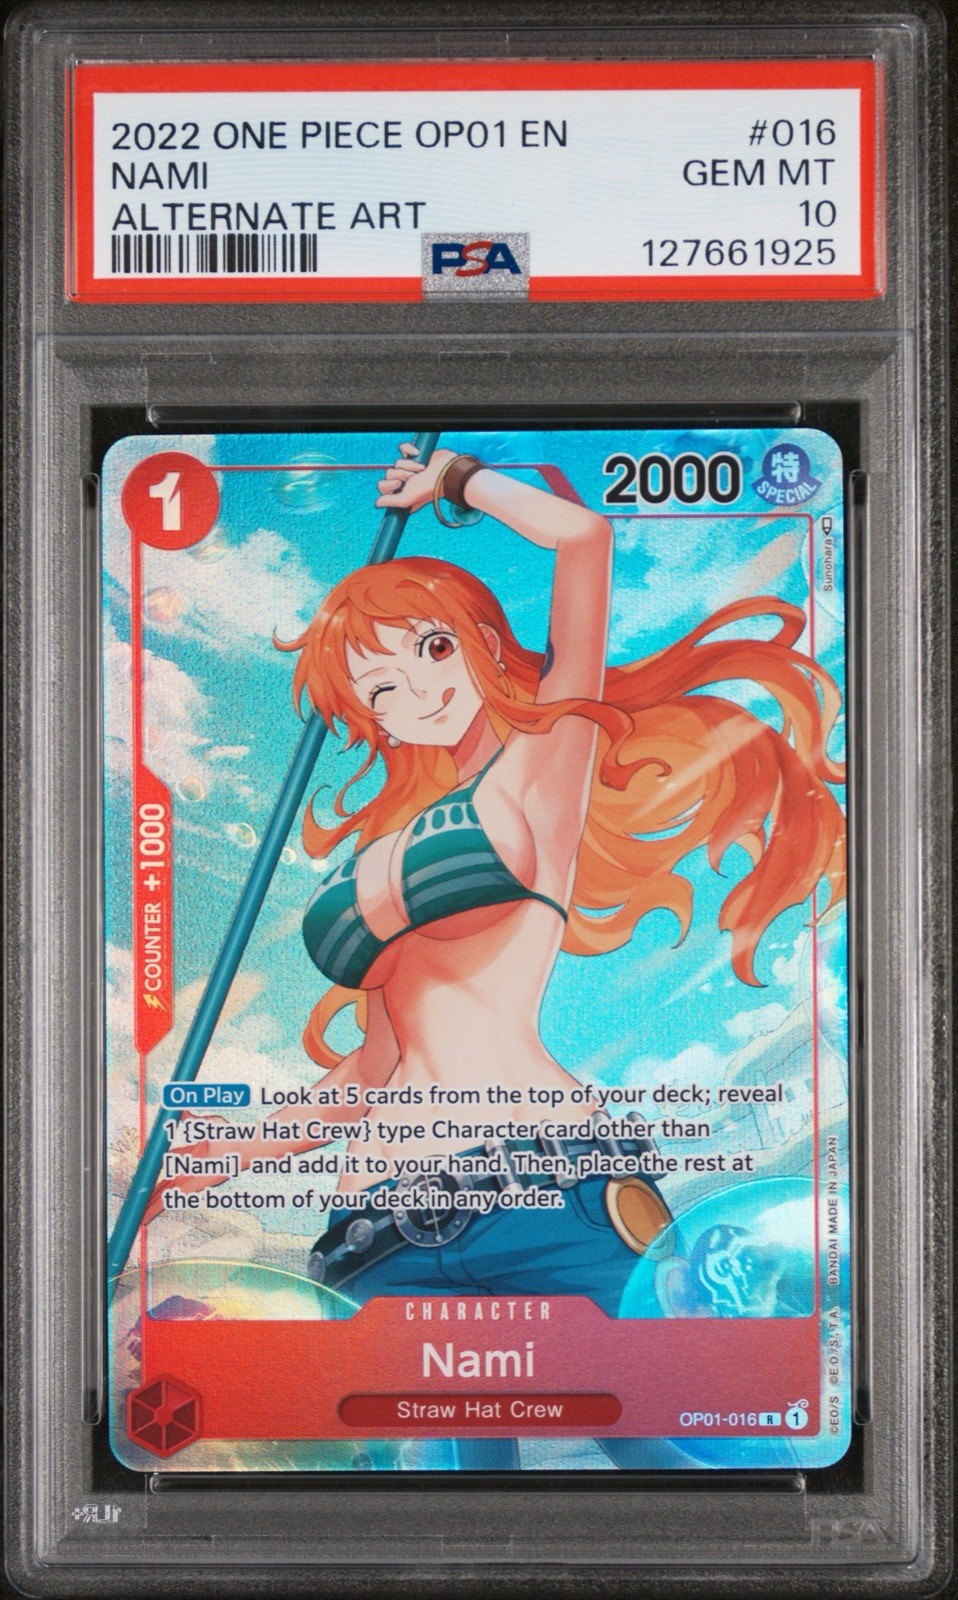
Nami — Alternate Art
The Traditional Benchmark: S&P 500 Returns
To put the TCG's growth in perspective, we can look at the S&P 500. This index tracks the 500 largest companies in the U.S. and is a reliable measure of "steady" growth.
| Year | S&P 500 Total Return (Approx.) |
|---|---|
| 2019 | +31.49% |
| 2020 | +18.40% |
| 2021 | +28.71% |
| 2022 | -18.11% |
| 2023 | +26.29% |
| 2024 | +25.02% |
| 2025 | +17.88% |
Historically, the S&P 500 delivers an average annual growth rate of about 9.8%.
Direct Performance Comparison
When you compare a blue-chip card like the PSA 10 Luffy ST05-119 to the stock market, the results are startling. In 2022-2023, the secondary price was roughly $300. By 2025, listings for various versions ranged from $650 to over $7,200. Even at the low end, that is a 116% gain. At the high end, it’s over 2,300%.
What This Means for Collectors
The comparison highlights two different worlds:
- Traditional Markets: The S&P 500 offers steady, long-term growth.
- One Piece TCG: Select cards can generate explosive returns in very short windows when hype and scarcity align.
However, card investing comes with risks. Markets are volatile and driven by nostalgia. Unlike a stock index, there is no "official" audited price for the TCG market. This is why data tools are becoming a necessity for anyone putting serious money into the game.
Track One Piece Cards with TCGIndex
If you want to move past guesswork, TheTCGIndex.com provides the data needed to make informed decisions. You can view real-time price movements, build custom indexes, and track portfolio performance over time.
View One Piece 100 Most Valuable IndexFinal Thoughts
The One Piece TCG combines fandom with genuine scarcity. When you look at the data, the contrast is clear. Stocks provide stability and diversification, while high-end TCG cards offer a speculative, high-reward alternative. Using tools like TheTCGIndex helps separate the hype from the actual trends.